ProteomicsDB
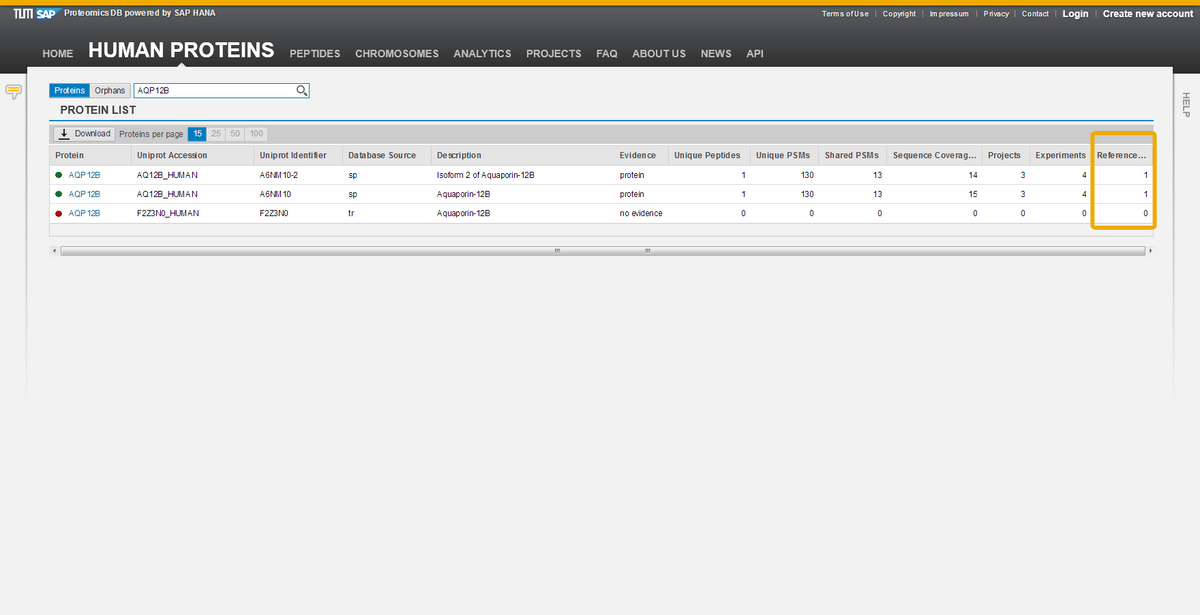
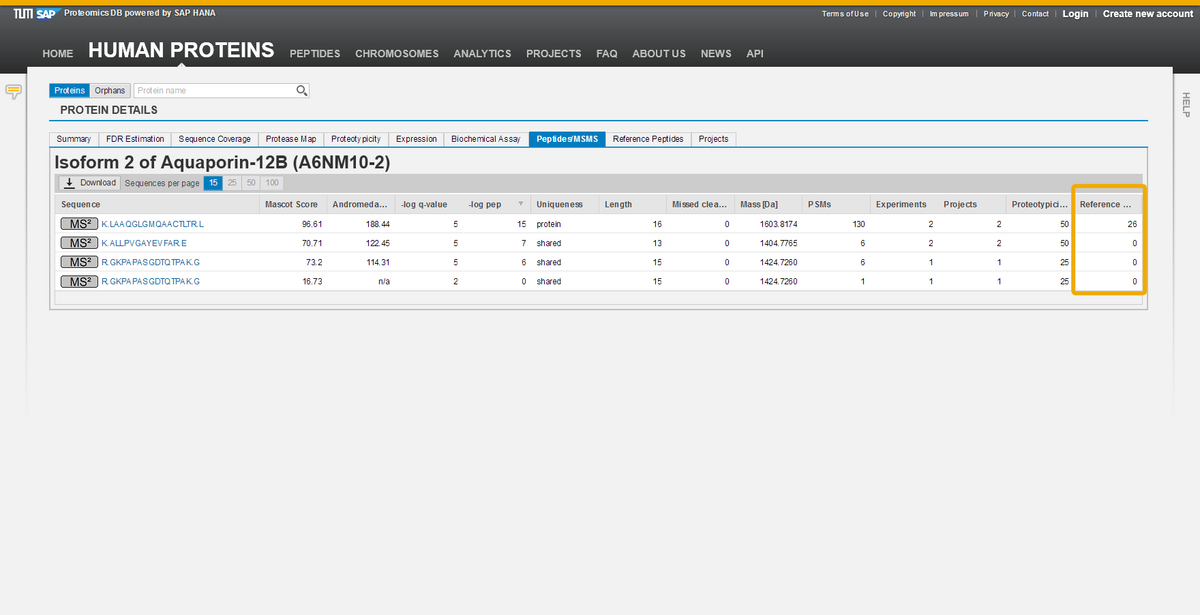
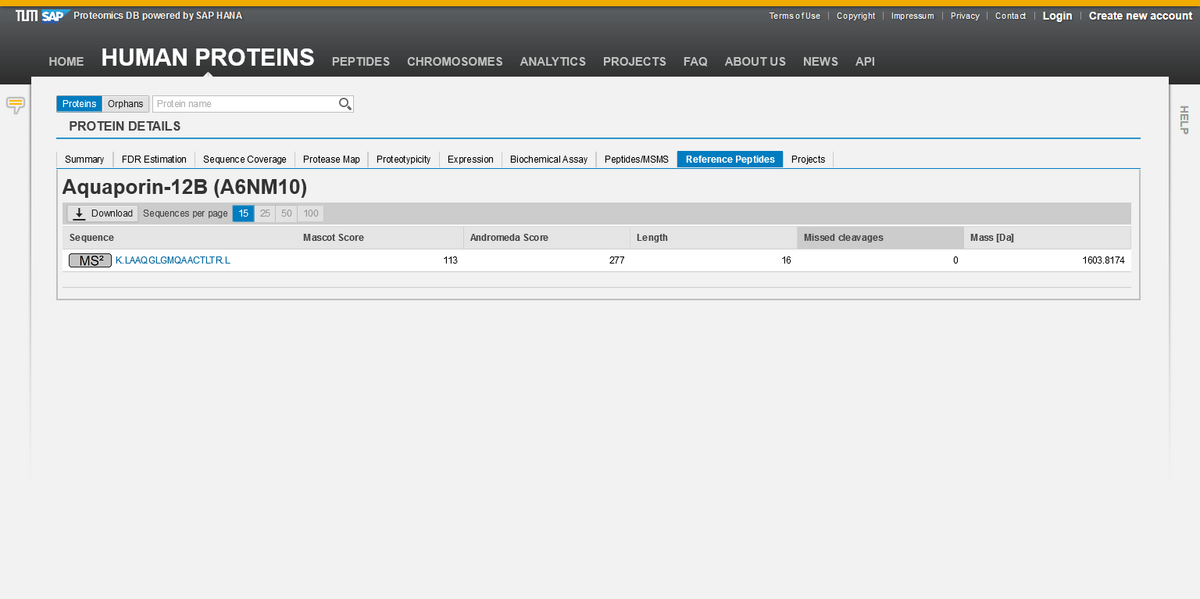
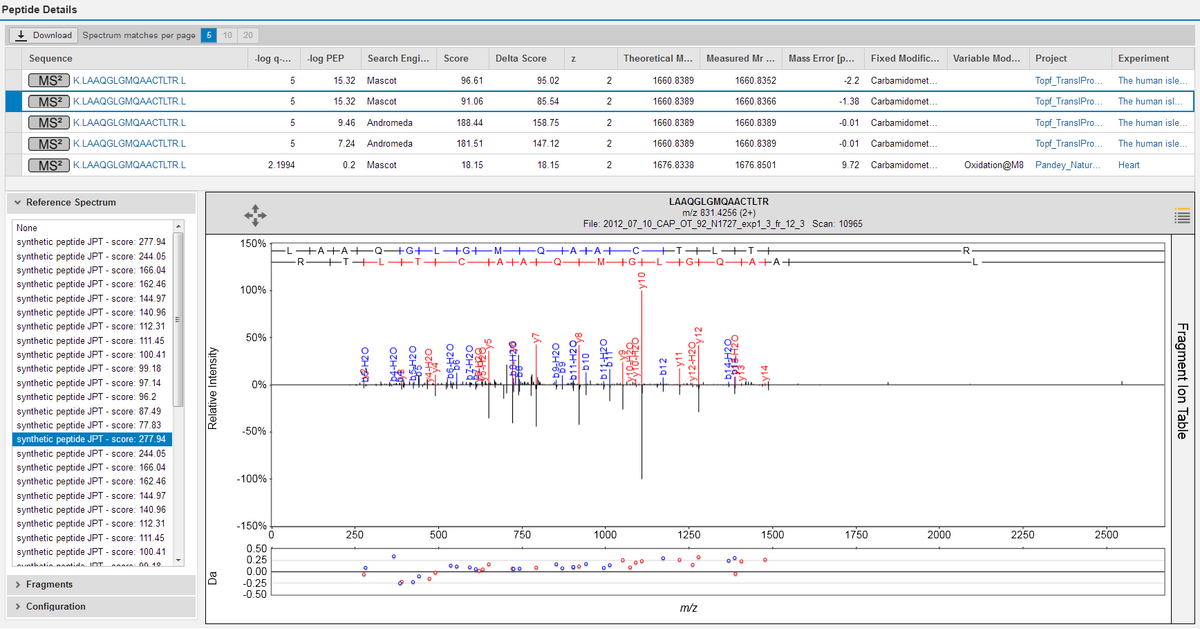
Fragmentation data for individual peptides are displayed under the “reference spectra” tab in ProteomicsDB.org. Mirror plots of spectra from endogenous and synthetic peptides are displayed under the “PeptidesMS/MS tab in ProteomicsDB.org. In total we added ~ 3 million spectra for >250.000 peptides to the database.
Click to enlarge example images.